Understanding ratios on smallcase factsheets [includes examples]
![Understanding ratios on smallcase factsheets [includes examples]](https://www.smallcase.com/wp-content/uploads/2023/02/Transparency-Changes-04-1-2048x1152.png)
Introduction
Understanding financial data is crucial for making informed investment decisions. smallcase factsheets offer valuable insights, but the financial ratios they present can be a barrier for new and experienced investors.
This guide aims to bridge that gap. We’ll provide a clear and concise explanation of key ratios commonly found in smallcase factsheets, empowering you to confidently analyze your investment.
Using the Value & Momentum smallcase as a practical example, we’ll break down each ratio and explain its significance. Additionally, we’ll compare it to a contrasting smallcase, the Dividend Stars smallcase, to illustrate how different investment strategies are reflected in these metrics.
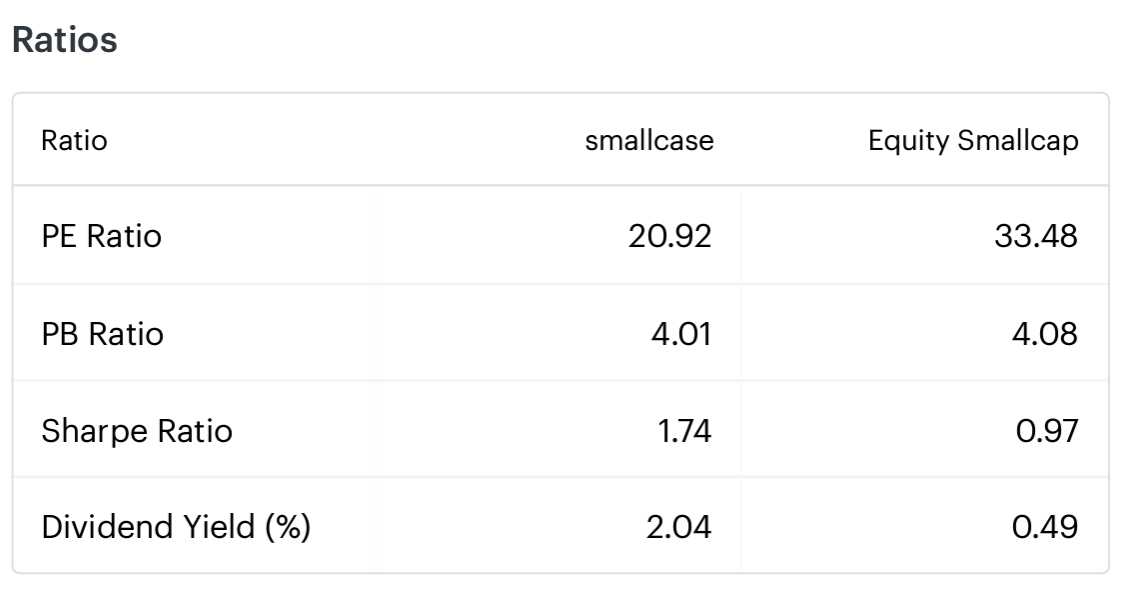
Dividend Stars smallcase
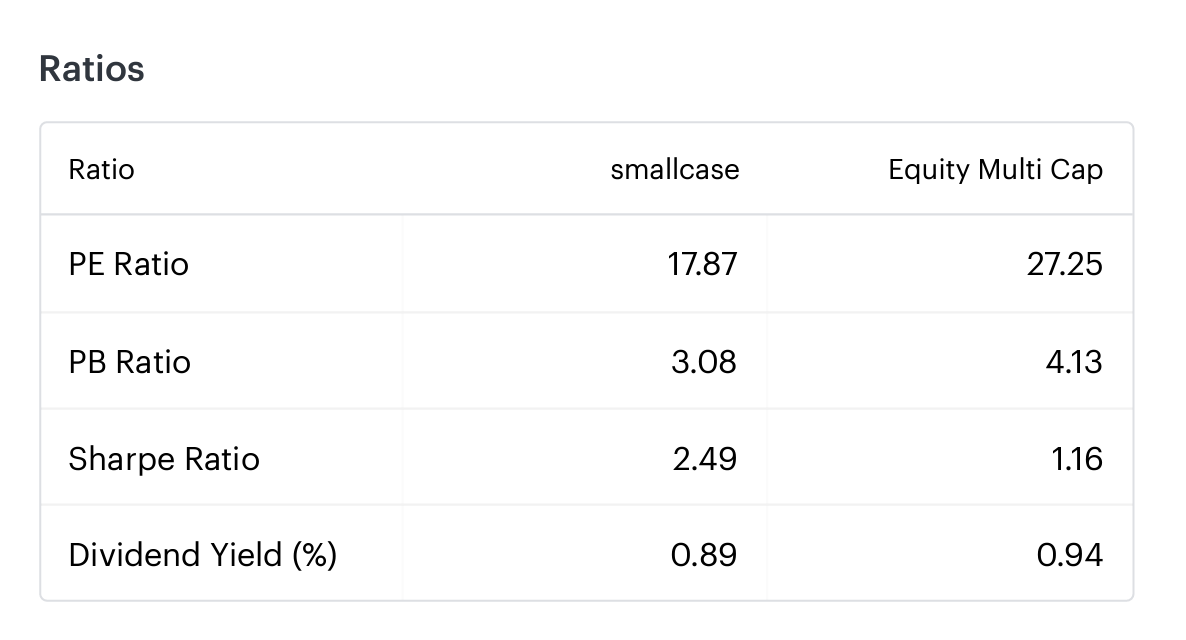
Value & Momentum smallcase
Calculated as of 23 Jun 2024.
What the Ratios Reveal
First, let us understand a little bit about the ratios and how they are computed. The ratios are calculated on a rolling basis and use financial year numbers. For example on 24th June 2024, the PE ratio is calculated using the latest index number of the smallcase and the aggregate of the weighted EPS of the constituents of the smallcase for the most recent financial year.
The comparable index of the smallcase is assigned based on the market cap distribution of the constituents of the smallcase. For example, if the aggregate of the weight of large-cap stocks is more than 50% then the comparable index is the universe of equity large-cap companies. If the weightage of large and mid-cap stocks is more than 30% each, then the universe of large and mid-cap stocks is the comparable index.
Let’s look at the four ratios mentioned in the factsheet.
Price-to-Earnings Ratio (PE Ratio): This metric tells you how much investors are paying for each rupee of a company’s earnings. A lower PE for the Value & Momentum smallcase (17.87) compared to the Dividend Stars smallcase (20.92) suggests a potential focus on undervalued companies, which is the core focus of Value & Momentum smallcase.
Price-to-Book Ratio (PB Ratio): This compares the market value of the smallcase to its net assets (assets minus liabilities). A lower PB ratio for the Value & Momentum smallcase (3.08) versus the Dividend Stars smallcase (4.01) hints that the Value & Momentum smallcase might be priced more reasonably relative to its book value. This aligns with a value investing strategy that seeks potentially undervalued companies.
Sharpe Ratio: This ratio goes beyond just returns. It considers risk-adjusted performance, essentially telling you how much return the smallcase generates for each unit of risk taken. A higher Sharpe Ratio is better. Here, the Value & Momentum smallcase boasts a ratio of 2.49 compared to the Dividend Stars smallcase’s 1.74. This suggests the Value & Momentum smallcase offers superior risk-adjusted returns.
Dividend Yield: This metric shows the annual dividend income an investor receives relative to the investment amount. While the Value & Momentum smallcase offers a yield of 0.89%, the Dividend Stars smallcase yields 2.04%. This significantly higher yield for the Dividend Stars smallcase makes it a more attractive option for income-seekers who prioritize a steady stream of income from their investments. Here, the contrasting investment strategies are evident. The Value & Momentum smallcase prioritizes potential capital appreciation, while the Dividend Stars smallcase focuses on companies with a history of paying regular dividends.
To understand more about how each financial ratios are calculated, you can check this blog here.
Takeaway
By comparing the Value & Momentum smallcase to the Dividend Stars smallcase, we can see how different investment strategies are reflected in the financial ratios. The Value & Momentum smallcase appears to be positioned for value investing along with employing momentum strategy, while the Dividend Stars smallcase prioritizes dividend payout.
Remember, these ratios are just one piece of the puzzle. Always consider your individual investment goals, risk tolerance, and broader market trends before making any decisions. Utilize this knowledge alongside your own research to choose the smallcase that best aligns with your investment strategy. Happy investing!
Disclaimer: Investment in securities market are subject to market risks. Read all the related documents carefully before investing. Registration granted by SEBI, membership of BASL (in case of IAs) and certification from NISM in no way guarantee performance of the intermediary or provide any assurance of returns to investors.
The content in these posts/articles is for informational and educational purposes only and should not be construed as professional financial advice and nor to be construed as an offer to buy /sell or the solicitation of an offer to buy/sell any security or financial products.Users must make their own investment decisions based on their specific investment objective and financial position and using such independent advisors as they believe necessary.Windmill Capital Team: Windmill Capital Private Limited is a SEBI registered research analyst (Regn. No. INH200007645) based in Bengaluru at No 51 Le Parc Richmonde, Richmond Road, Shanthala Nagar, Bangalore, Karnataka – 560025 creating Thematic & Quantamental curated stock/ETF portfolios. Data analysis is the heart and soul behind our portfolio construction & with 50+ offerings, we have something for everyone. CIN of the company is U74999KA2020PTC132398. For more information and disclosures, visit our disclosures page here.

You may want to read


