How Does an ETF Work? An Easy Guide to Understanding Exchange-Traded Funds

An exchange-traded fund (ETF) is a type of mutual fund that is traded on stock exchanges, much like individual stocks. It’s a popular choice for investors because it offers a way to invest in a collection of assets, such as stocks, bonds, or commodities, through a single fund. ETFs are regulated products and traded throughout the day, giving investors more flexibility.
Given, we have a number of ETF based smallcases, we thought it would be interesting to talk to y’all about the workings of an ETF.
What is an ETF?
At its core, an ETF is a “basket” of investments. When you buy a unit of an ETF, you’re essentially buying a small piece of all the assets in that basket. For example, an ETF that tracks the Nifty 50 Index will hold shares of all the 50 companies in that index. This way, an investor can own a broad collection of assets without having to buy each stock individually, which would be time-consuming and costly. ETFs are designed to offer a low-cost, simple way for investors to gain exposure to a wide variety of markets, sectors, or commodities.
How Does an ETF Track an Index or Commodity?
ETFs are commonly designed to “track” an index, like the Nifty 50, or a commodity, like gold. This means that the goal of the ETF is to match/mimic the performance of its target index or asset. The way that ETFs track their target is through a simple replication. For example, a Nifty 50 ETF will hold all the 50 stocks in the index as per the weightage of the index. Therefore, when the Nifty 50 index rises, the ETF is also expected to rise by almost the same proportion and similarly decrease in value when the index falls. Similarly, in the case of Gold ETFs, these funds hold physical gold which tracks the prices and is valued accordingly.
How is an ETF created?
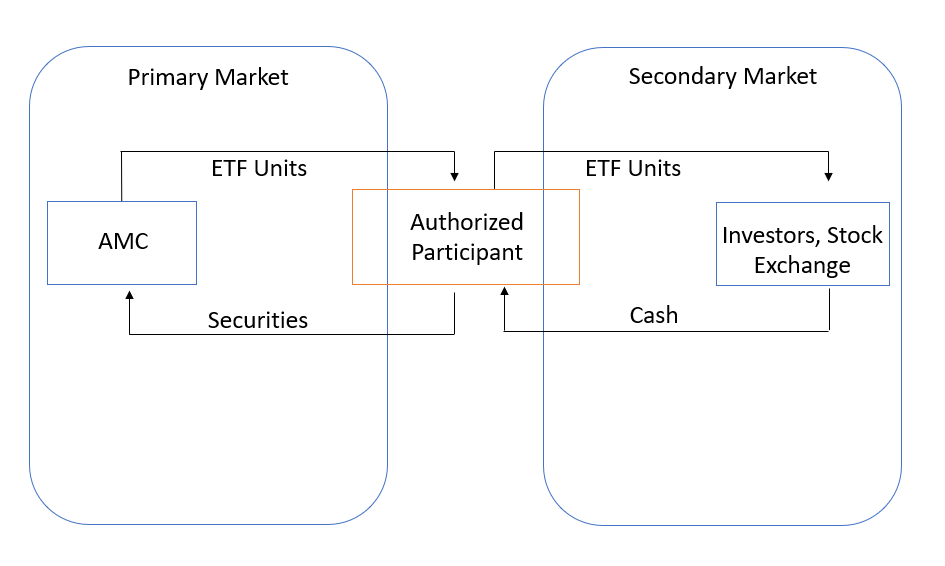
To create an ETF, there’s a process involving something called a creation unit. A creation unit is a large block consisting of a certain amount of units that make one basket. Without getting into the technicalities, from an understanding perspective, this creation unit is relevant for Authorized participants (APs) or Market Makers (MMs) which are usually large institutions. This comes into use when they subscribe or redeem ETF units from the Asset Management Company (AMC) directly. Let’s understand this with the help of a flowchart.

In simple words, there are two things that take place. First, the AP comes to the ETF provider (AMC), gives securities and in turn takes ETF units. For example, in the case of Gold ETF, the AP will give gold to the AMC and take units. Second, the AP sells those units to investors on the stock exchange as well as buys units from investors (who wish to sell their units) from the market itself. .
The Role of Market Makers and NAV
Once an ETF is on the market, it’s managed to ensure that it continues to closely match the value of the assets it is tracking. The ETF’s price is determined by market demand and supply but also influenced by a market maker. A market maker’s role is to provide liquidity and ensure that the ETF trades close to its Net Asset Value (NAV), which is the value of the underlying assets.
Before we go any further, it’s essential to understand the concept of NAV. Net Asset Value is basically the total value of all the assets (like stocks or commodities) it holds, divided by the number of outstanding units. It’s a way to see what each share of the ETF is worth based on the actual value of the investments. NAV is updated daily/real time (indicative or intraday NAV) and helps investors know the real worth of the ETF’s single unit. An example would help.
- ETF Assets Under Management (AUM) – ₹100 crores;
- ETF Outstanding Units – 50 Lakhs
Therefore, NAV = (A/B) = (₹100 crores/50 Lakhs) = ₹200.
Now, market makers ensure that the market price is close to the NAV by buying or selling units. They provide quotes on both sides (i.e. buy & sell) in order to maintain the market price closer to the actual value or NAV of the ETF. If the price falls below the NAV, they might reduce supply to bring the prices back up and if the price rises above the NAV, they might increase the supply to bring down the price. This balancing process is what keeps ETF prices closely aligned with the value of their underlying assets. Market makers are like goalkeepers standing on both buy and sell side quotes of the underlying ETF in the secondary market.
What should you look at before investing in an ETF?
There are few basic KPIs that an investor must check before investing in an ETF.
First, is the expense ratio. Expense ratio is a small yearly fee that an investor pays for owning an ETF. It covers the costs of managing the fund, like paying for the custody charges, exchange charges, and any other operational expenses. The expense ratio is shown as a percentage of your total investment. For example, if a fund has an expense ratio of 1%, you would pay ₹10 per year for every ₹1,000 you have invested. Ideally you would want to pick an ETF which has a lower expense ratio meaning less of your money goes to fees, leaving more in the fund to grow over time.
Second is tracking difference and tracking error. Tracking Difference (TD) and Tracking Error (TE) are terms used to describe how closely an ETF follows the performance of its benchmark index.
- Tracking Difference is the difference between the return of the ETF and the return of the index it’s supposed to track over a specific period. If the index goes up 10% in a year but the ETF only goes up 9.5%, the tracking difference is -0.5%. This difference is often due to fees, or other costs.
- Tracking Error measures the consistency of this difference over time. It shows how much the ETF’s performance fluctuates compared to its index. A low tracking error means the ETF closely follows the index with little deviation, while a high tracking error indicates it drifts more from the index.
In simple terms, tracking difference tells us the average gap in returns, while tracking error shows how steady that gap is. Again, you would want to have an ETF with a low TD and TE.
What is also important and you should take into account is the bid-ask spread of the ETF counter. Simply put, take a look at the buy and sell quotes. If the difference between prices are wide between both sides, then you could look to stay away from such ETFs as trading in them could involve significant impact cost. The ideal scenario is when the buy and sell quotes are close to the NAV and more importantly close to each other as well.
Refer to the screenshot below. This is an unfavorable scenario for an investor. Why? The i-NAV of the ETF is 87.81 however the market price is around 78.75. Additionally, check out the difference between the bid price and the ask price (or bid-ask spread). Almost 20 paise, that’s a significant difference.

So, what is favorable? This. The market price is closer to the i-NAV and the bid-ask spread is narrow. Also, the depth of the ETF counter is essential. Suppose you wish to put a buy order of 50,000 units of an ETF. In the first case, your pricing will become arbitrary as there is hardly any depth (37 quantities, then 15,052 quantities, then again 52 quantities). Quite scattered, right? Now refer to the second case. Here the depth is much better and your order will get executed at the first ask price (i.e. ₹65.19) itself.

Not to mention, when it comes to investing in ETFs, you should be sure about the risk that the underlying index (which is being tracked by the ETF) is carrying. For example, if you are a risk averse investor, choosing a smallcap index based ETF would not be a bright idea as small caps are inherently riskier than say large caps.
What is the difference between an ETF and an Index Fund?
Many folks get confused between an ETF and an Index Fund. In order to understand this better, we will talk about one ETF and one Index Fund both tracking the Nifty 50 Index.
| Particulars | Nippon India Index Fund – Nifty 50(Direct Plan) | Nippon India Nifty Bees ETF |
|---|---|---|
| Expense Ratio | 0.20 | 0.04 |
| Tracking Error | 0.05% | 0.03% |
The obvious question that you would ask is why should you be paying almost 5 times higher expense ratio for an index fund tracking the same index as an ETF?
The answer is that index funds almost always have a higher expense ratio when compared to their ETF counterparts. The reason being that there are additional charges that have to be borne by an AMC to run index funds as compared to ETFs. And most of us miss this obvious equation. Sure, there are framework differences between the two. As in, index funds do not require you to have a demat account and can be traded at the end of the day NAV. While, ETFs require a demat account and trade real-time. In the end, it depends on the investor’s use case. However, if you are agnostic to having/not having a demat, what option would you choose to invest?
Conclusion
ETFs are a powerful investment tool because they offer a low-cost, flexible way to gain exposure to a wide range of assets. They are designed to mirror the performance of a specific index, sector, or commodity, which makes them an appealing choice for both beginner and experienced investors. By combining aspects of individual stocks and mutual funds, ETFs give investors a highly accessible way to diversify their portfolios. With the roles of market makers and creation units, ETFs stay closely tied to the value of the assets they represent, offering a balance between risk, convenience, and return potential.
Disclaimer: Investment in securities market are subject to market risks. Read all the related documents carefully before investing. Registration granted by SEBI, membership of a SEBI recognized supervisory body (if any) and certification from NISM in no way guarantee performance of the intermediary or provide any assurance of returns to investors.
The content in these posts/articles is for informational and educational purposes only and should not be construed as professional financial advice and nor to be construed as an offer to buy /sell or the solicitation of an offer to buy/sell any security or financial products.Users must make their own investment decisions based on their specific investment objective and financial position and using such independent advisors as they believe necessary.
Windmill Capital Team: Windmill Capital Private Limited is a SEBI registered research analyst (Regn. No. INH200007645) based in Bengaluru at No 51 Le Parc Richmonde, Richmond Road, Shanthala Nagar, Bangalore, Karnataka – 560025 creating Thematic & Quantamental curated stock/ETF portfolios. Data analysis is the heart and soul behind our portfolio construction & with 50+ offerings, we have something for everyone. CIN of the company is U74999KA2020PTC132398. For more information and disclosures, visit our disclosures page here.


