From Market Highs to Corrections: What’s Driving the Shift and How to Invest Wisely

Our previous newsletter provided an in-depth analysis of the stock market’s performance throughout 2024. While we highlighted the strong market returns, we also discussed key challenges such as the impact of the Fed rate cut and FII activity.
In this article, let’s take a closer look at market performance since October 2024 and explore the factors driving the recent sell-off.
Since October 2024, Indian markets have been trending downward, driven by concerns over falling Rupee, FPI selling, oil price rise due to geopolitical tensions, and cautious investor sentiment due to frothy valuation. As a result, the Nifty 100 has dropped by approximately 12%, while the Nifty Midcap 100 and Nifty Smallcap 100 have also declined approximately by 13% and 14%, respectively.
Rupee depreciation
In the foreign exchange market, a currency’s price is determined by its demand and supply, similar to any other product. When demand rises while supply remains constant, the price increases to balance availability. Conversely, when demand falls, sellers lower prices to attract buyers.
For example, if foreign investors increase investments in India, the demand for INR rises, strengthening the rupee against the USD. Conversely, if capital outflows increase due to global uncertainties, demand for USD rises, causing the INR to depreciate.
Since October 24, the INR has depreciated by over 3% against the USD. However, this trend is not unique to the INR, as many other currencies have also weakened, with some experiencing even larger declines. The table below provides a comparison.
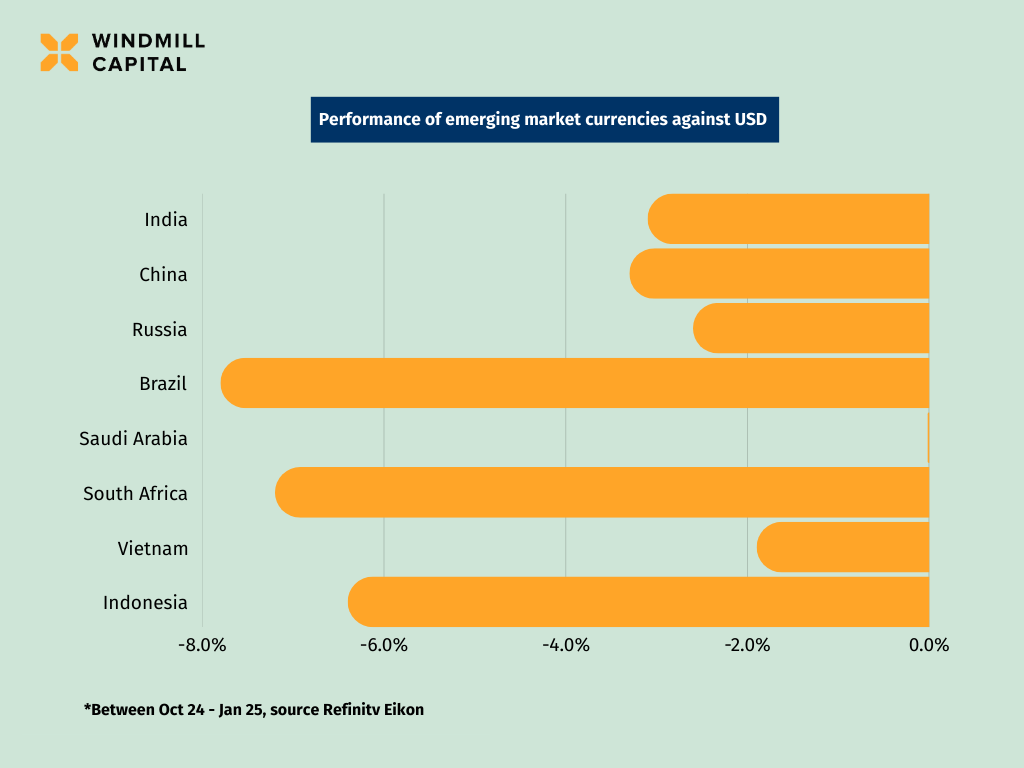
Let’s delve into the reasons for the depreciation:
- Strengthening USD
This seems obvious given that Rupee is depreciating, however there is a subtle difference. While the INR can fall due to domestic factors without the USD necessarily strengthening globally, in the present case the US Dollar gaining strength indicates that it is appreciating against multiple currencies, not just INR. And this is obvious from the table above. There are a couple of reasons why the USD is strengthening.
The U.S. economy is expected to grow 2.7% in 2024, outpacing other developed markets (1.7%), driven by strong productivity, investment, and a stable labor market. The new administration’s emphasis on domestic manufacturing, tariffs, and deregulation could boost business growth and maintain higher interest rates, strengthening the USD. Persistent growth may keep inflation above 2%, delaying Fed rate cuts and preventing dollar depreciation.
- FPI Outflow
Foreign Portfolio Investors invested just ₹427 cr in Indian equity markets during calendar year 2024. In Jan 2025, they have pulled out ₹78,027 cr. Compare this with ~₹1.7 lakh crore invested in 2023. Higher valuation of Indian equities, poor quarterly results and expectation of tepid earning season are making FPI’s wary. In addition, the uncertainty surrounding Donald Trump’s policies has led foreign investors to adopt a cautious approach, steering clear of riskier investments in emerging markets.
Results
We have discussed in extensive detail the Q2FY2025 results and you can read more about it here. To summarise, in Q2 FY2025, 4 out of 11 sectors saw a revenue slowdown, but 7 sectors experienced a decline in net profits growth. Factors such as weak demand, stagnant consumer budgets, competition from the unorganized sector, and category saturation have contributed to this downturn.
The stress has continued in this quarter as well. In Q3 FY2025, we analyzed the reported and estimated total revenue and net profit of Nifty 100 constituents to assess performance trends. So far, 65 out of 101 companies have announced their results, forming our analysis universe. 43.1% of these companies reported lower-than-expected revenue, while 52.3% posted net profits below analyst estimates, indicating a sharper earnings disappointment.
We also checked the 6 month change in FY2025 estimates for Nifty 100 companies.
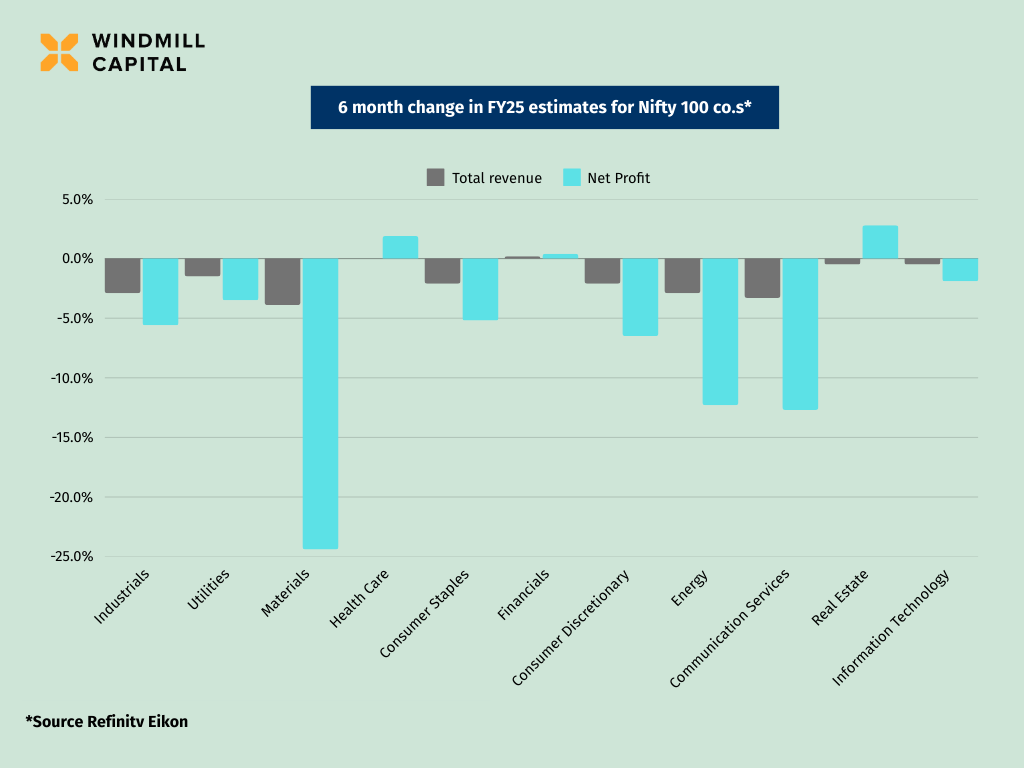
As evident, revenue and net profit estimates have been revised downward for all sectors except real estate, healthcare and financials sector.
Crude oil prices
After months of speculation, in Jan 2025 U.S. imposed strict sanctions on Russia’s oil sector, blacklisting nearly 200 shadow fleet vessels and targeting major oil producers Gazprom Neft and Surgutneftegas. The move aims to reduce Russia’s oil revenues funding the war from February 2022 while providing Kyiv and the incoming Trump administration leverage in potential peace negotiations.
Earlier in Nov 2024, the U.S. had sanctioned 118 individuals and entities linked to Russia’s financial sector and war efforts. Targets include Gazprombank, other Russian banks with global ties, and key banking officials. Additionally, the Treasury issued an alert on sanctions risks for entities using Russia’s System for Transfer of Financial Messages, designed to bypass restrictions.
Because of this, global oil prices have been trending up. Brent Crude Future price is up almost 12% since mid – Sept’24.
In 2024, Russia supplied 41% of India’s crude oil imports, providing a cheaper alternative. However, U.S. sanctions could disrupt 1.5 million barrels per day of Russian oil to India, leading to higher import costs. This disruption will hurt refining margins and add pressure on the economy, already dealing with high inflation and slow domestic growth.
Valuation concerns
A strong 24% earnings growth in Nifty 50 stocks from FY21 to FY24, coupled with a surge in retail investor participation—through direct equities, SIPs in mutual funds, and insurance—had propelled the market valuation to remarkable highs. Between Sept 2023 – Sept 2024, PE ratio of Nifty 100 jumped up by 9.6%, Nifty Midcap 100 PE ratio surged by 79% to 45x and that of Nifty Smallcap 100 was up 36.8% to 35.8x. We had highlighted the issue of frothy valuations in our Sept 24 AMA.
The table below breaks down the PE performance for large, mid and smallcap universe of stocks between Sept 23 and Sept 24.
PE growth indicates the % change in PE ratio between the end of Sept 23 and Sept 24.
EPS growth shows the % change in trailing 12 months EPS of large, mid and smallcap stocks between Sept 23 and Sept 24. Stocks are classified as large, mid and smallcap based on their market cap rank.
Index growth indicates the % change in Nifty 100, Nifty Midcap 100 and Nifty Smallcap 100 indices between the end of Sept 23 and Sept 24.
| PE Growth | Index growth | Comment | |
| Largecap | 9.6% | 37.4% | Prices surged resulting in moderate P/E expansion. The rally supported improved market sentiment, signaling a segment re-rating without overvaluation. |
| Midcap | 79.1% | 48.4% | The segment saw substantial P/E expansion, driven by valuation, raising overvaluation concerns. |
| Smallcap | 36.8% | 50.4% | The segment’s price growth led to rerating in valuation due to market optimism. |
Budget and expected market performance
In 2024, Indian equities were among the top global performers, with the Nifty 500 delivering a 16.2% return despite global uncertainties and domestic transitions. However, the recent market correction is driven by concerns over a weakening rupee, FPI outflows, rising oil prices due to geopolitical tensions, and stretched valuations.
The Union Budget 2025-26 aims to boost economic growth, drive private sector investments, and support middle-class spending, while acknowledging global risks. However, despite its pro-growth stance, external pressures may limit its immediate market impact.
However, structural reforms such as the ₹10 lakh crore Asset Monetization Plan, ₹1.5 lakh crore in 50-year interest-free loans for states, and the ₹1 lakh crore Urban Challenge Fund set the stage for long-term, investment-led growth. These initiatives aim to strengthen capital formation, enhance economic resilience, and support domestic expansion, creating a solid foundation for market stability and sustained development.
Conclusion
At Windmill Capital, we firmly believe that process outweighs results, adopting a structured, disciplined approach in everything we do—from ideating new smallcases to managing and rebalancing them. Since returns, risk, and market cycles are unpredictable, a strong process ensures consistency and better decision-making in an uncertain market.
All Windmill Capital smallcases are designed with a long-term investment horizon in mind. For large-cap-focused smallcases, we recommend an investment period of at least 3 years, while mid- and small-cap-oriented smallcases require 4-7 years to navigate market cycles and achieve sustainable growth.
Before investing, it’s crucial to assess your risk profile—defining your goals, time horizon, and financial situation—to ensure the smallcase aligns with your investment objectives. Whether you prioritize growth, income, capital preservation, or thematic exposure, a well-structured approach will help you stay confident and committed despite market volatility.
Disclaimer: Investment in securities market are subject to market risks. Read all the related documents carefully before investing. Registration granted by SEBI, membership of a SEBI recognized supervisory body (if any) and certification from NISM in no way guarantee performance of the intermediary or provide any assurance of returns to investors.
The content in these posts/articles is for informational and educational purposes only and should not be construed as professional financial advice and nor to be construed as an offer to buy /sell or the solicitation of an offer to buy/sell any security or financial products.Users must make their own investment decisions based on their specific investment objective and financial position and using such independent advisors as they believe necessary.Windmill Capital Team: Windmill Capital Private Limited is a SEBI registered research analyst (Regn. No. INH200007645) based in Bengaluru at No 51 Le Parc Richmonde, Richmond Road, Shanthala Nagar, Bangalore, Karnataka – 560025 creating Thematic & Quantamental curated stock/ETF portfolios. Data analysis is the heart and soul behind our portfolio construction & with 50+ offerings, we have something for everyone. CIN of the company is U74999KA2020PTC132398. For more information and disclosures, visit our disclosures page here.


